Section outline

    • After watching the short introductory video at metabase.com, follow the installation instructions at https://www.metabase.com/docs/latest/installation-and-operation/running-the-metabase-jar-file#local-installation to install Metabase. Basically, you need to install Java and download the metabase.jar file. After starting Metabase, you can access it using your browser at http://localhost:3000.

    • Task
      • Familiarize yourself with the Metabase tool and the sample x-rays. You can find the documentation at https://www.metabase.com/learn/.
      • Add our two SQLite files as separate datasets. You can also 
        upload CSVs to Metabase to the Sample Database.
      • Create a stacked bar chart (a bar for each type of domestic accommodation) over time. You can find documentation at https://www.metabase.com/learn/metabase-basics/querying-and-dashboards/visualization/bar-charts. It's fine to follow their example to learn about the bar chart and then translate your learning into your own bar chart.
        Did you notice the data problem for clinics/centers and clinics?
        Accommodation of Domestic Visitors
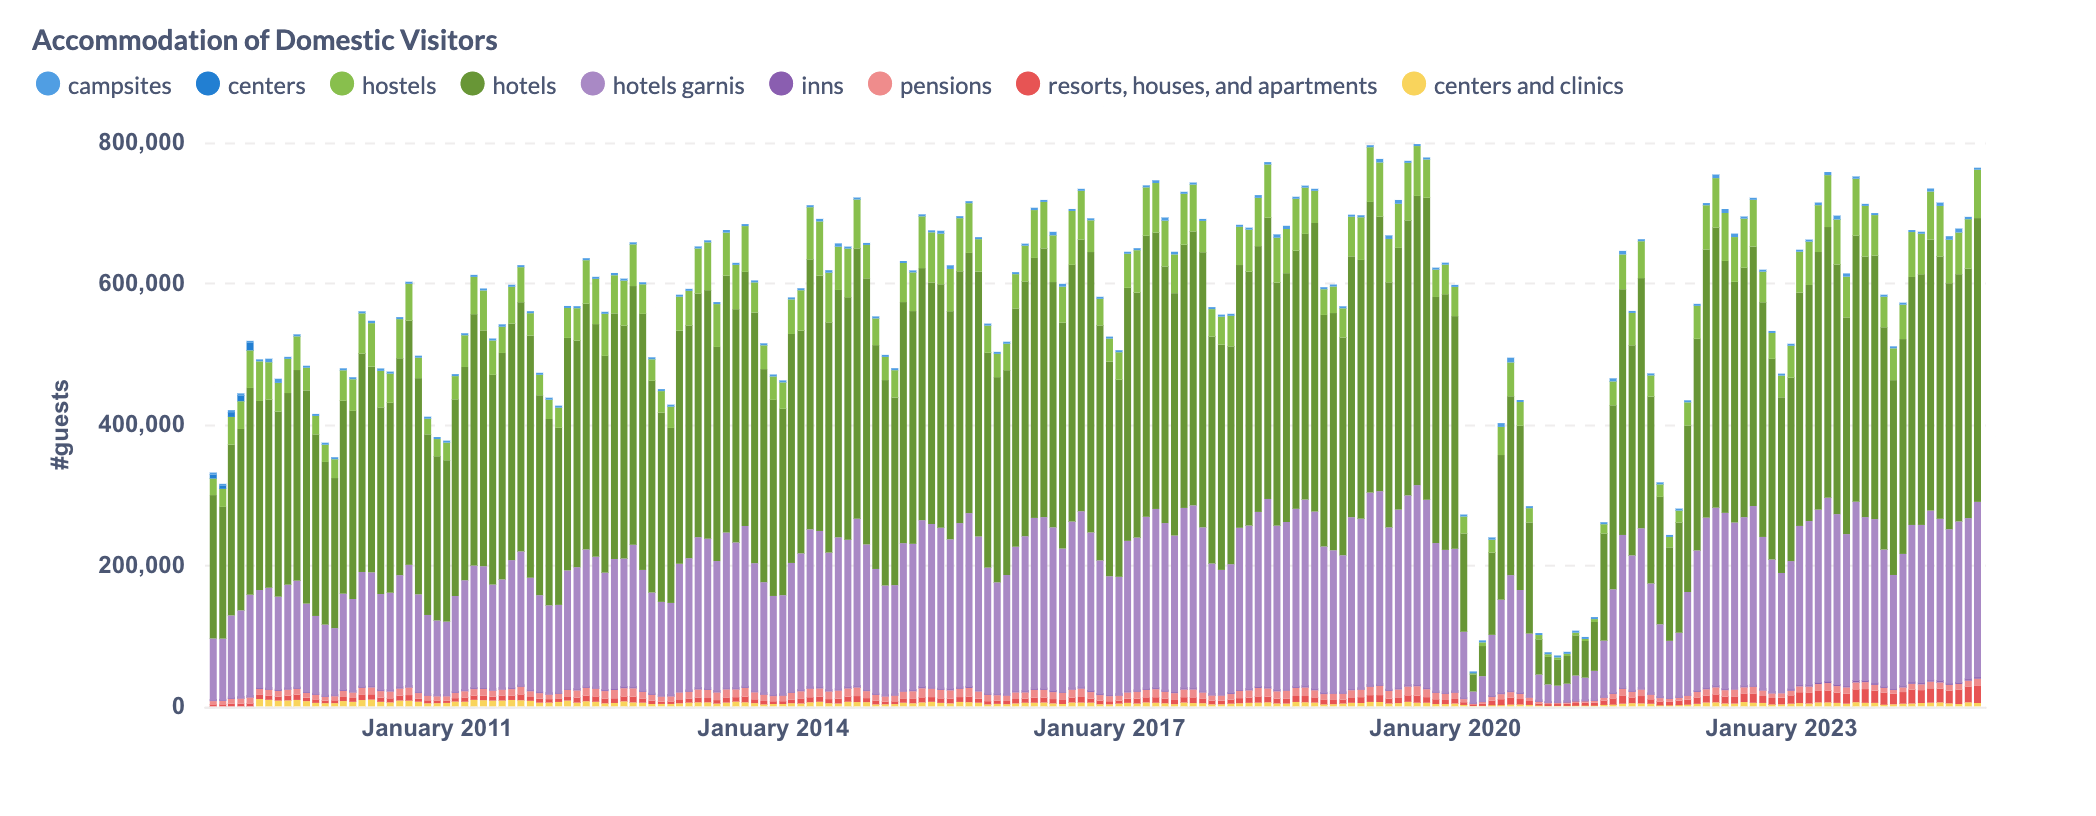
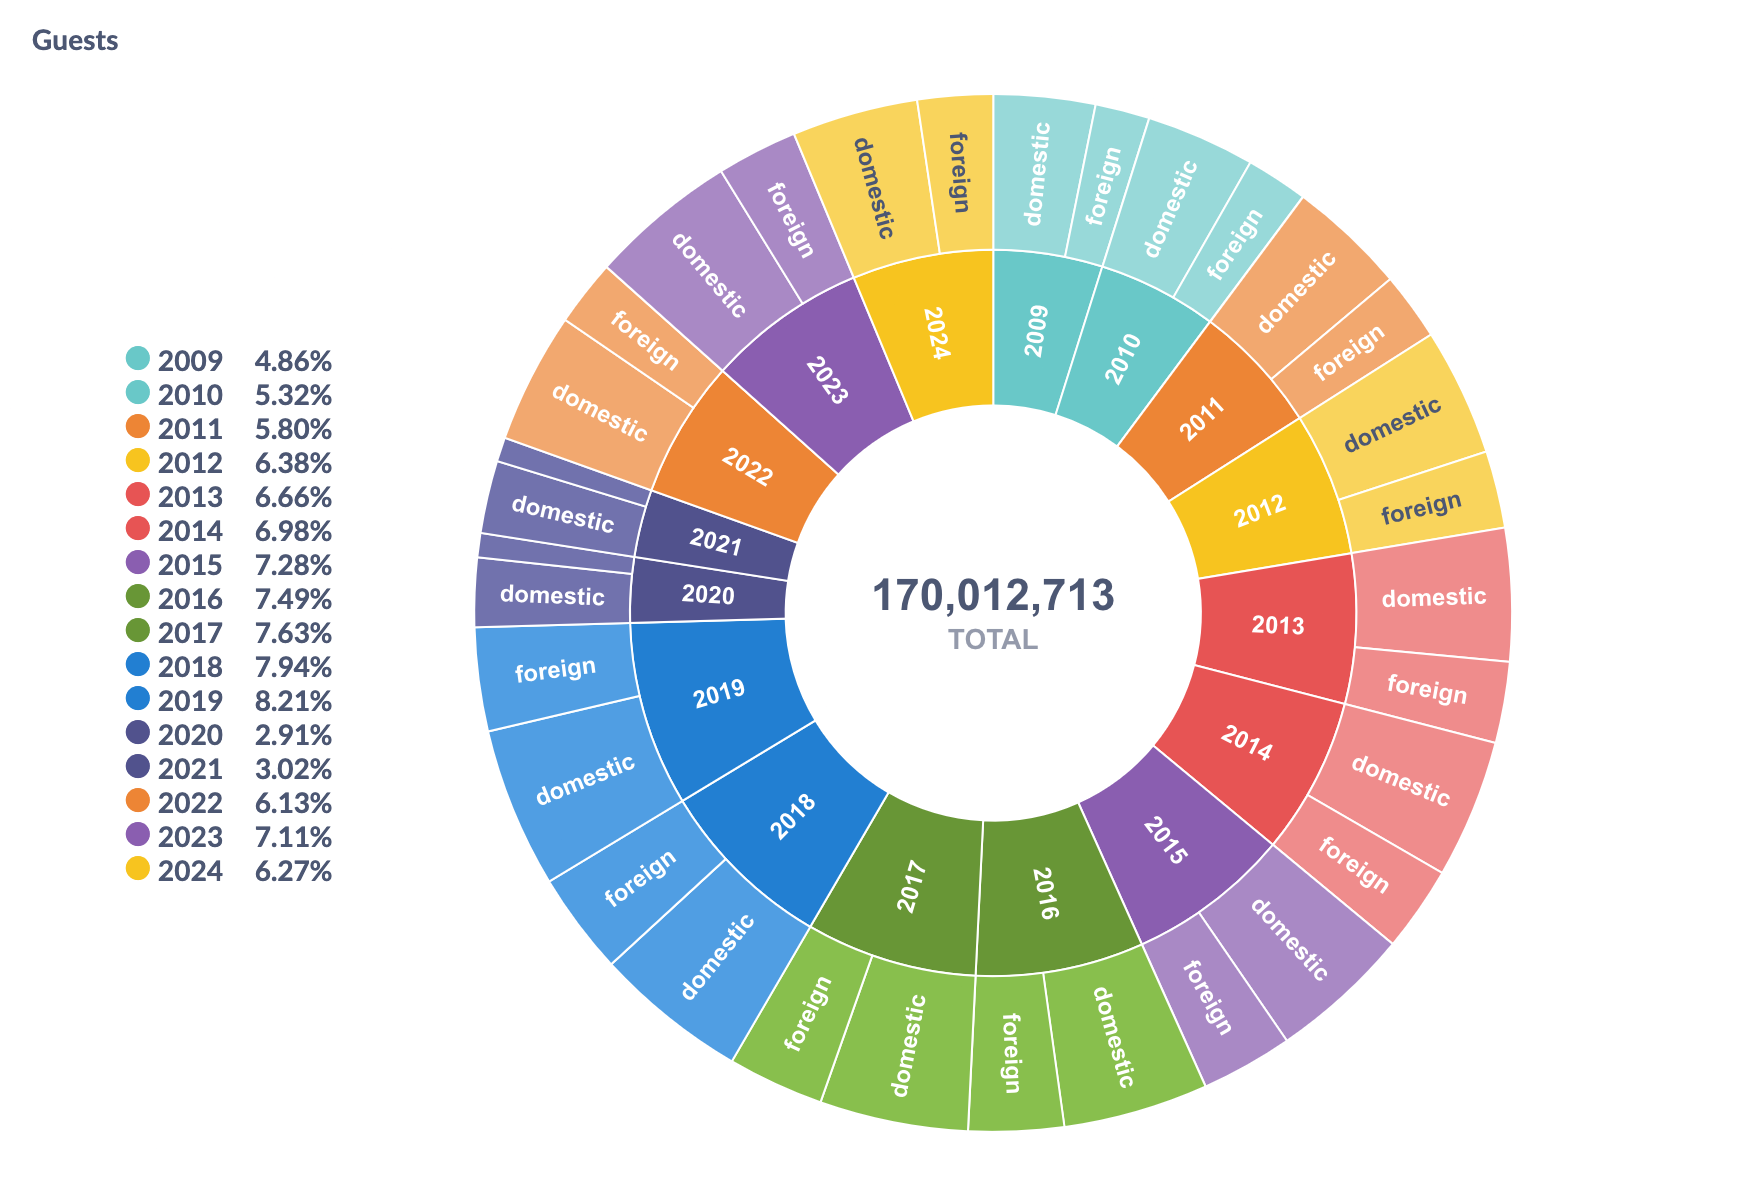
      • Now that you are familiar with the basics of Metabase how about you create some new chart of your own using the data. Remember you can select, filter, aggregate, and group the data prior to visualizing it. Present your created chart in class.
    • Visitor wheel

    • Task
      • Create a chart showing the top foreign residences of people visiting Berlin.
        It could look something like the chart below
        Top Residences
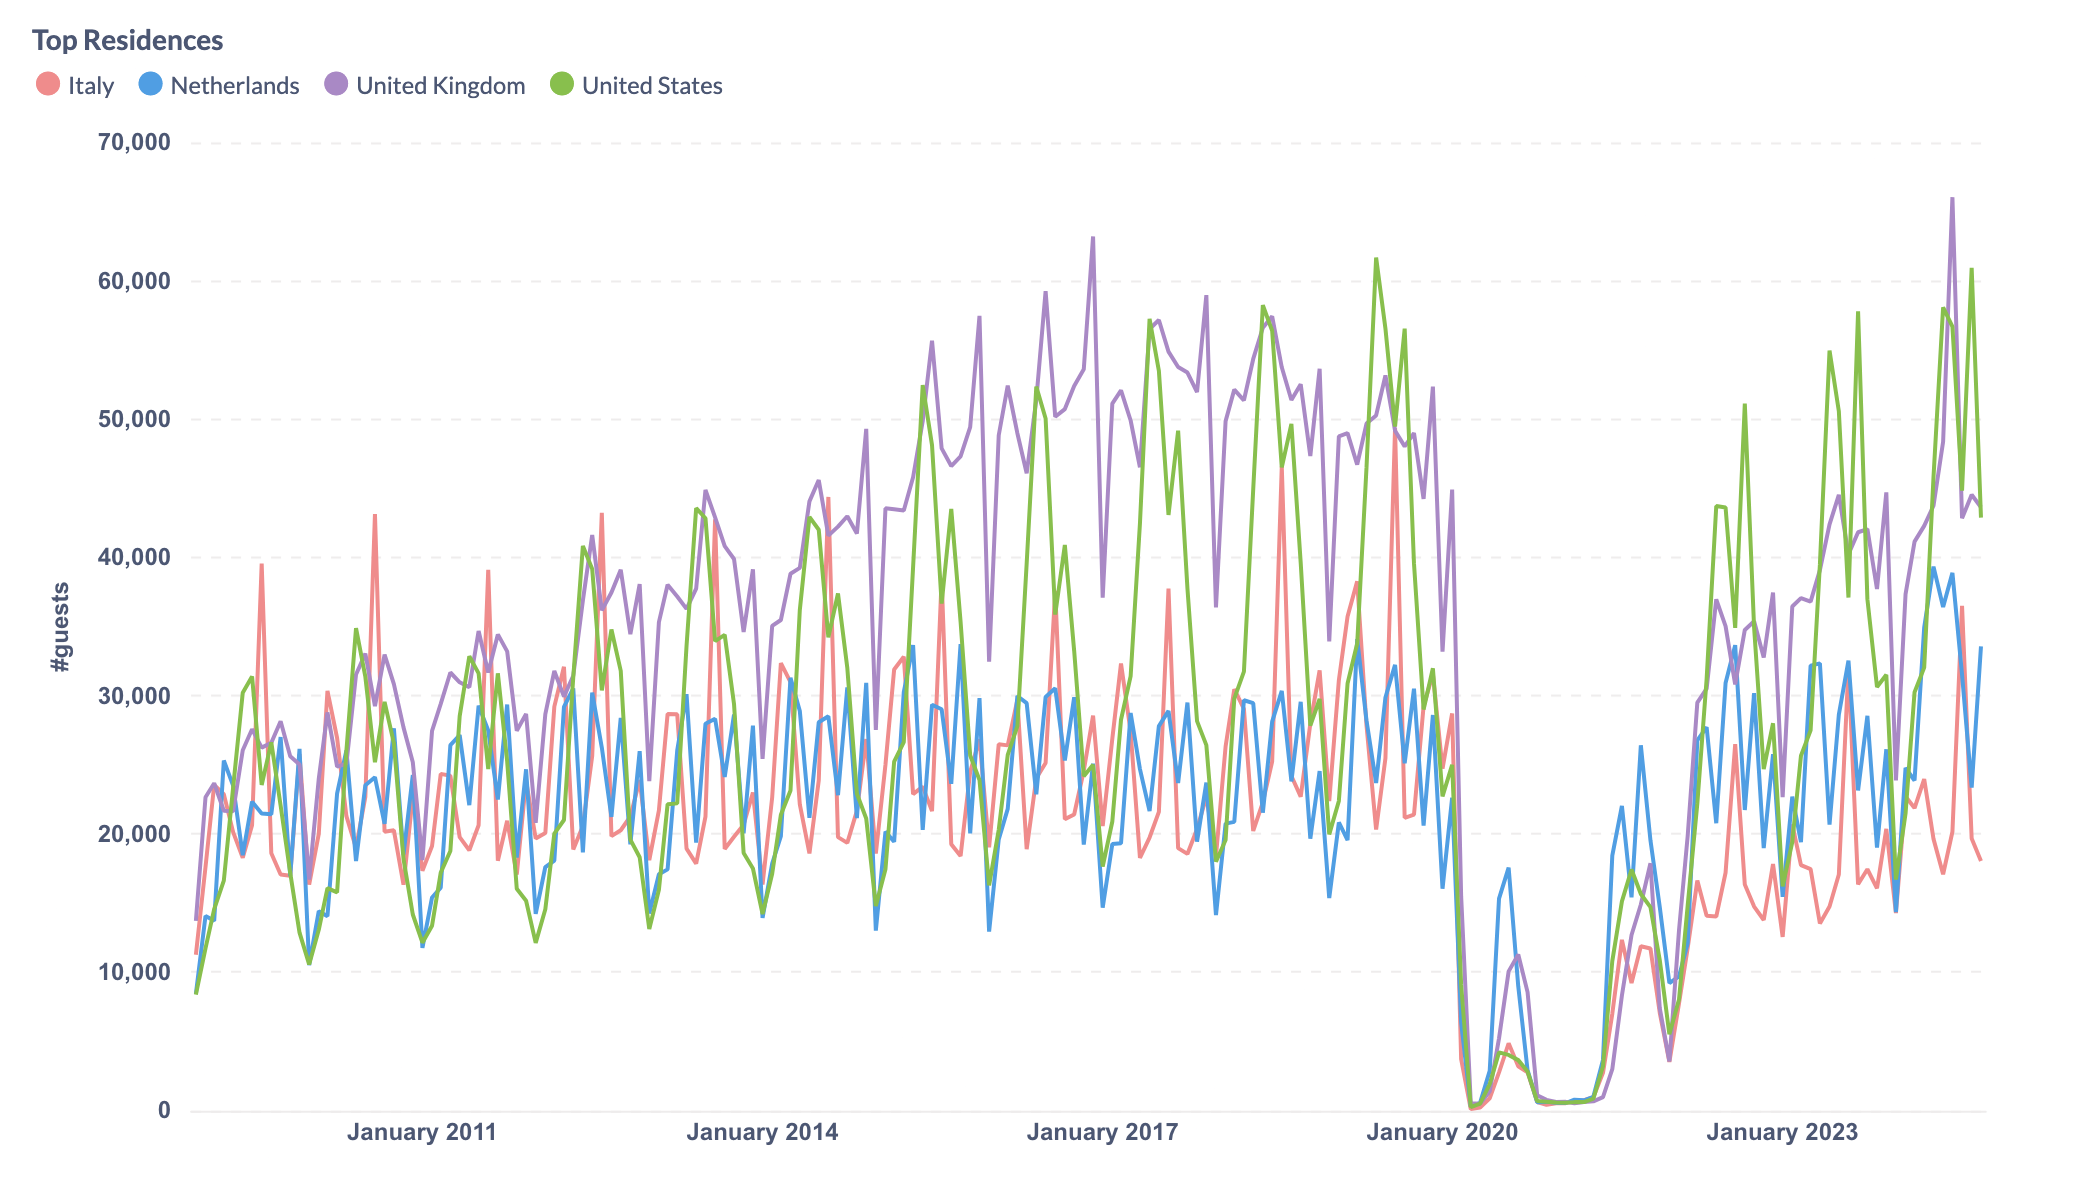
      • When do the two regularly occurring peaks happen over the year for visitors from the US? Can you make out differences within these two peaks?
    • Task
      • It is possible to predict the number of future visitors from historical data. We will do this starting tomorrow. What are downsides to predicting the number of visitors this way? What are the implicitly made assumptions?
      • What are indicators predictive of visitors? Which could be publicly accessed and downloaded and help us predicting US visitors?
    • Task
      • With Google Trends you can get data from Google showing what people search on Google depending on certain time spans and geographic locations. Play with Google Trends. Can you find search terms with a similar pattern than our Berlin visitors from the US?
      • What is the value that reported by Google to indicate the volume of searches (the y-axis on the Google Trends charts). Research the definition and draw conclusions when comparing different search terms using Google Trends.
    • "Indexing: Google Trends data is pulled from a random, unbiased sample of Google searches, which means we don’t have exact numbers for any terms or topics. In order to give a value to terms, we index data from 1-100, where 100 is the maximum search interest for the time and location selected."
      "Normalization: When we look at search interest in a topic or query, we are not looking at the total number of searches. Instead, we look at the percentage of searches for that topic, as a proportion of all searches at that time and location."

      from https://newsinitiative.withgoogle.com/resources/trainings/basics-of-google-trends/ and see also https://support.google.com/trends/answer/4365533

    • Task
      • Building on yesterday's exploration of data from Google Trends, let's create a final chart contrasting the official data of US visitors with searches on Google. For this download the google_trends.sqlite file below.
      • This file contains of two tables which have to be joined by month year to combine/enrich the data. You can read about joins at https://www.metabase.com/docs/latest/questions/query-builder/join.
      • As an inspiration your final chart, could look at follows:
        Google Trends and Actual Visitors from the US
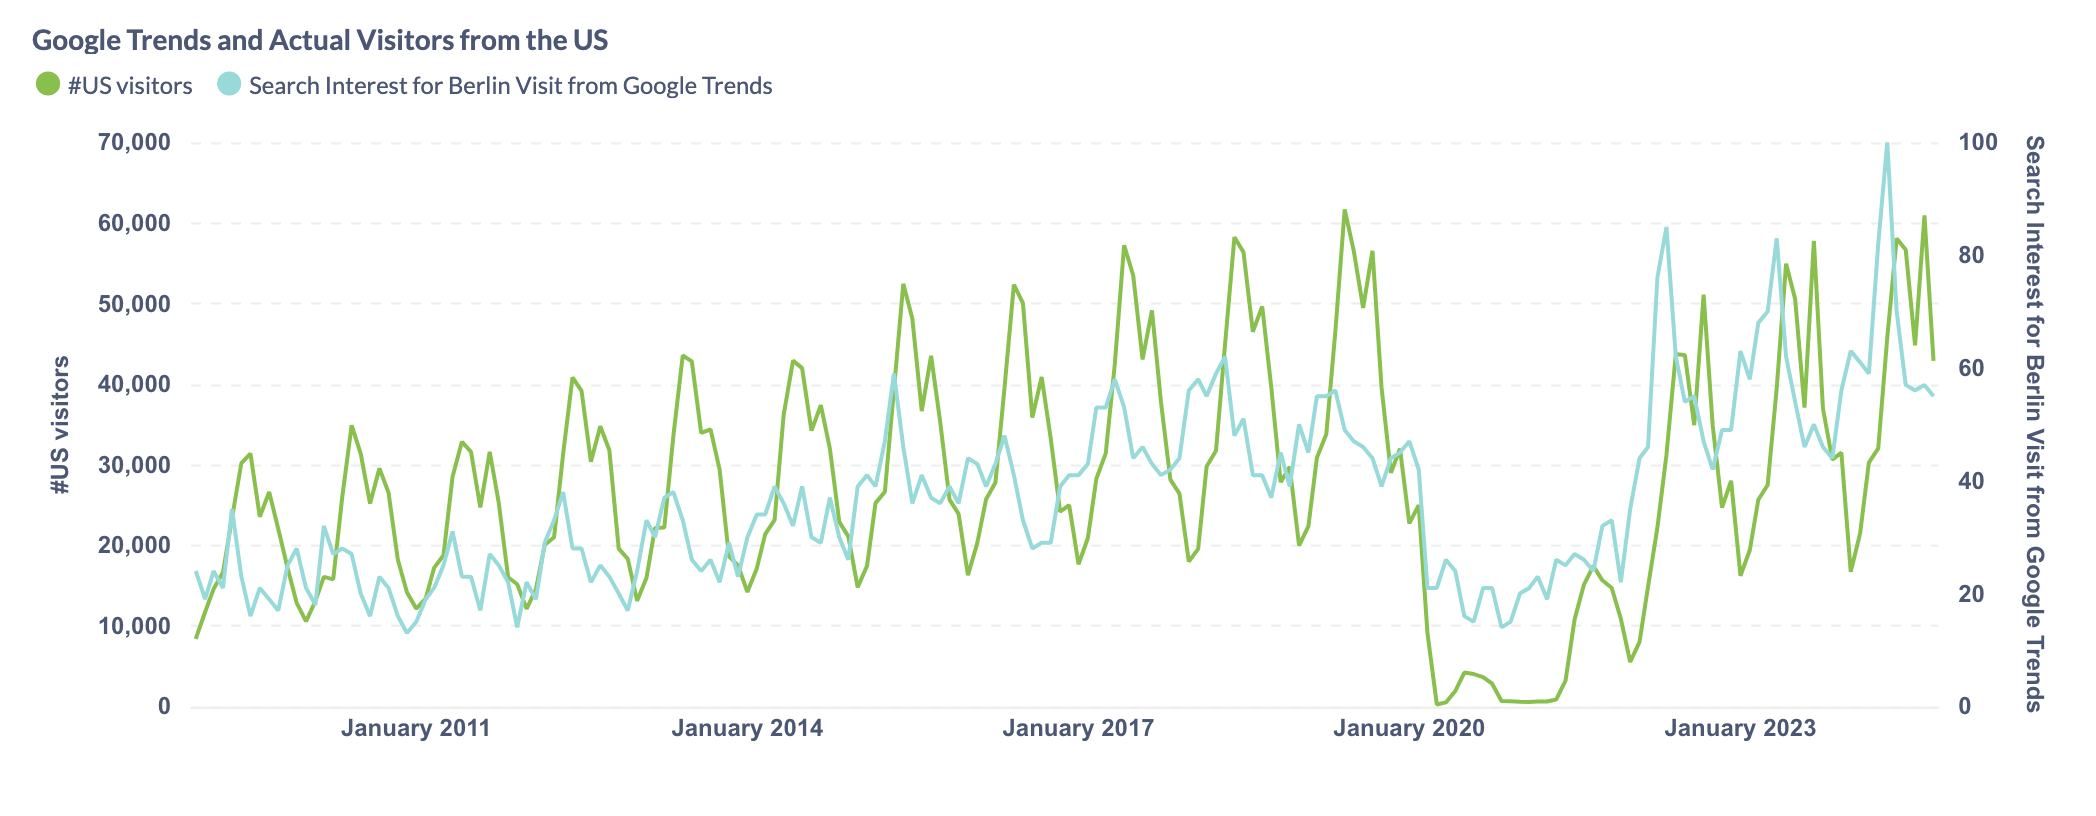
Note the two y-axes.
    • This file contains Google Trends information and the data about Berlin visitors.