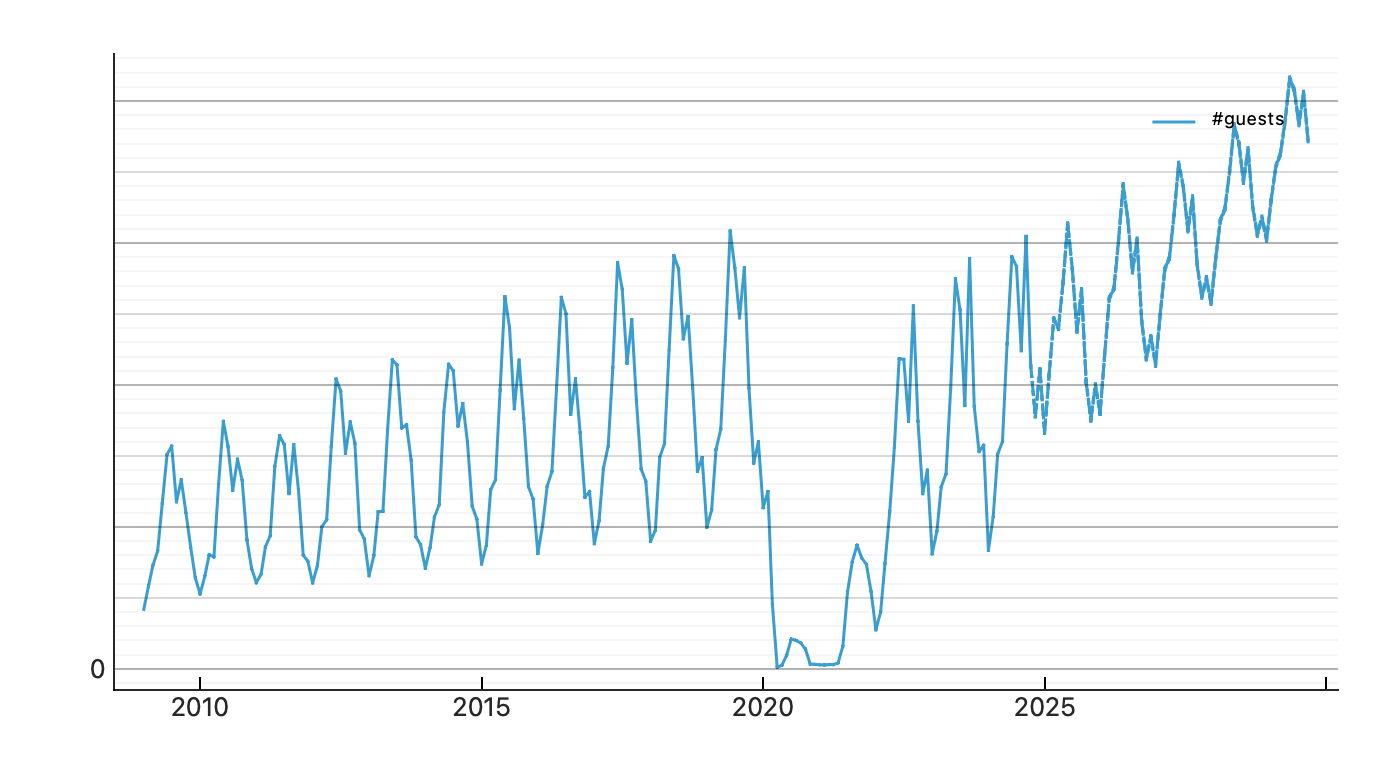
Схема розділу

    • Task
      • Orange is an software for data mining. It does not require any textual programming. The data analysis is performed by arranging nodes and edges where nodes are representing the operations and the edges represent the flow of the data. Install Orange from the official sources at https://orangedatamining.com/download/.
      • Familiarize yourself with Orange by loading the Berlin visitors data below and filter for the US residence. Look at the data using the Data Table.
    • Task
      • Based on the above video, create a forecast for the US visitors for our data. Play with the (hyper-)parameters similarly to how Nathan Humphrey is doing it. Can you make it work? If not, speculate why it might not work. Research about ARIMA and SARIMA models.
      • In addition, try out the Seasonal Adjustment node and create a line chart with trend, seasonal and residual plots.
        Note, the needed workaround Edit Domain for a bug in Orange (see https://github.com/biolab/orange3-timeseries/issues/281) to fix the error
        variable month_year is not in domain in the Seasonal Adjustment widget.
    • If you want to use Orange in a computer pool, you can follow these instructions for setting it up:

      1. Download the portable Version of Orange for Windows from https://orangedatamining.com/download/ and extract the zip file in some folder
        Be patient. It takes some time to extract the file since it contains lots of files and data.
      2. Navigate to the folder and double click on the link called Orange.
        Again be patient. Starting Orange for the first time usually takes longer but later starts are quicker.

      This setup was tested in the computer pool room 05.110 using Orange 3.38.1.

      These instructions might also work on others computers.

    • Forecast Pipeline in Orange

    • Trend, Season, and Residuals

    • Task
      • Yesterday, you used the
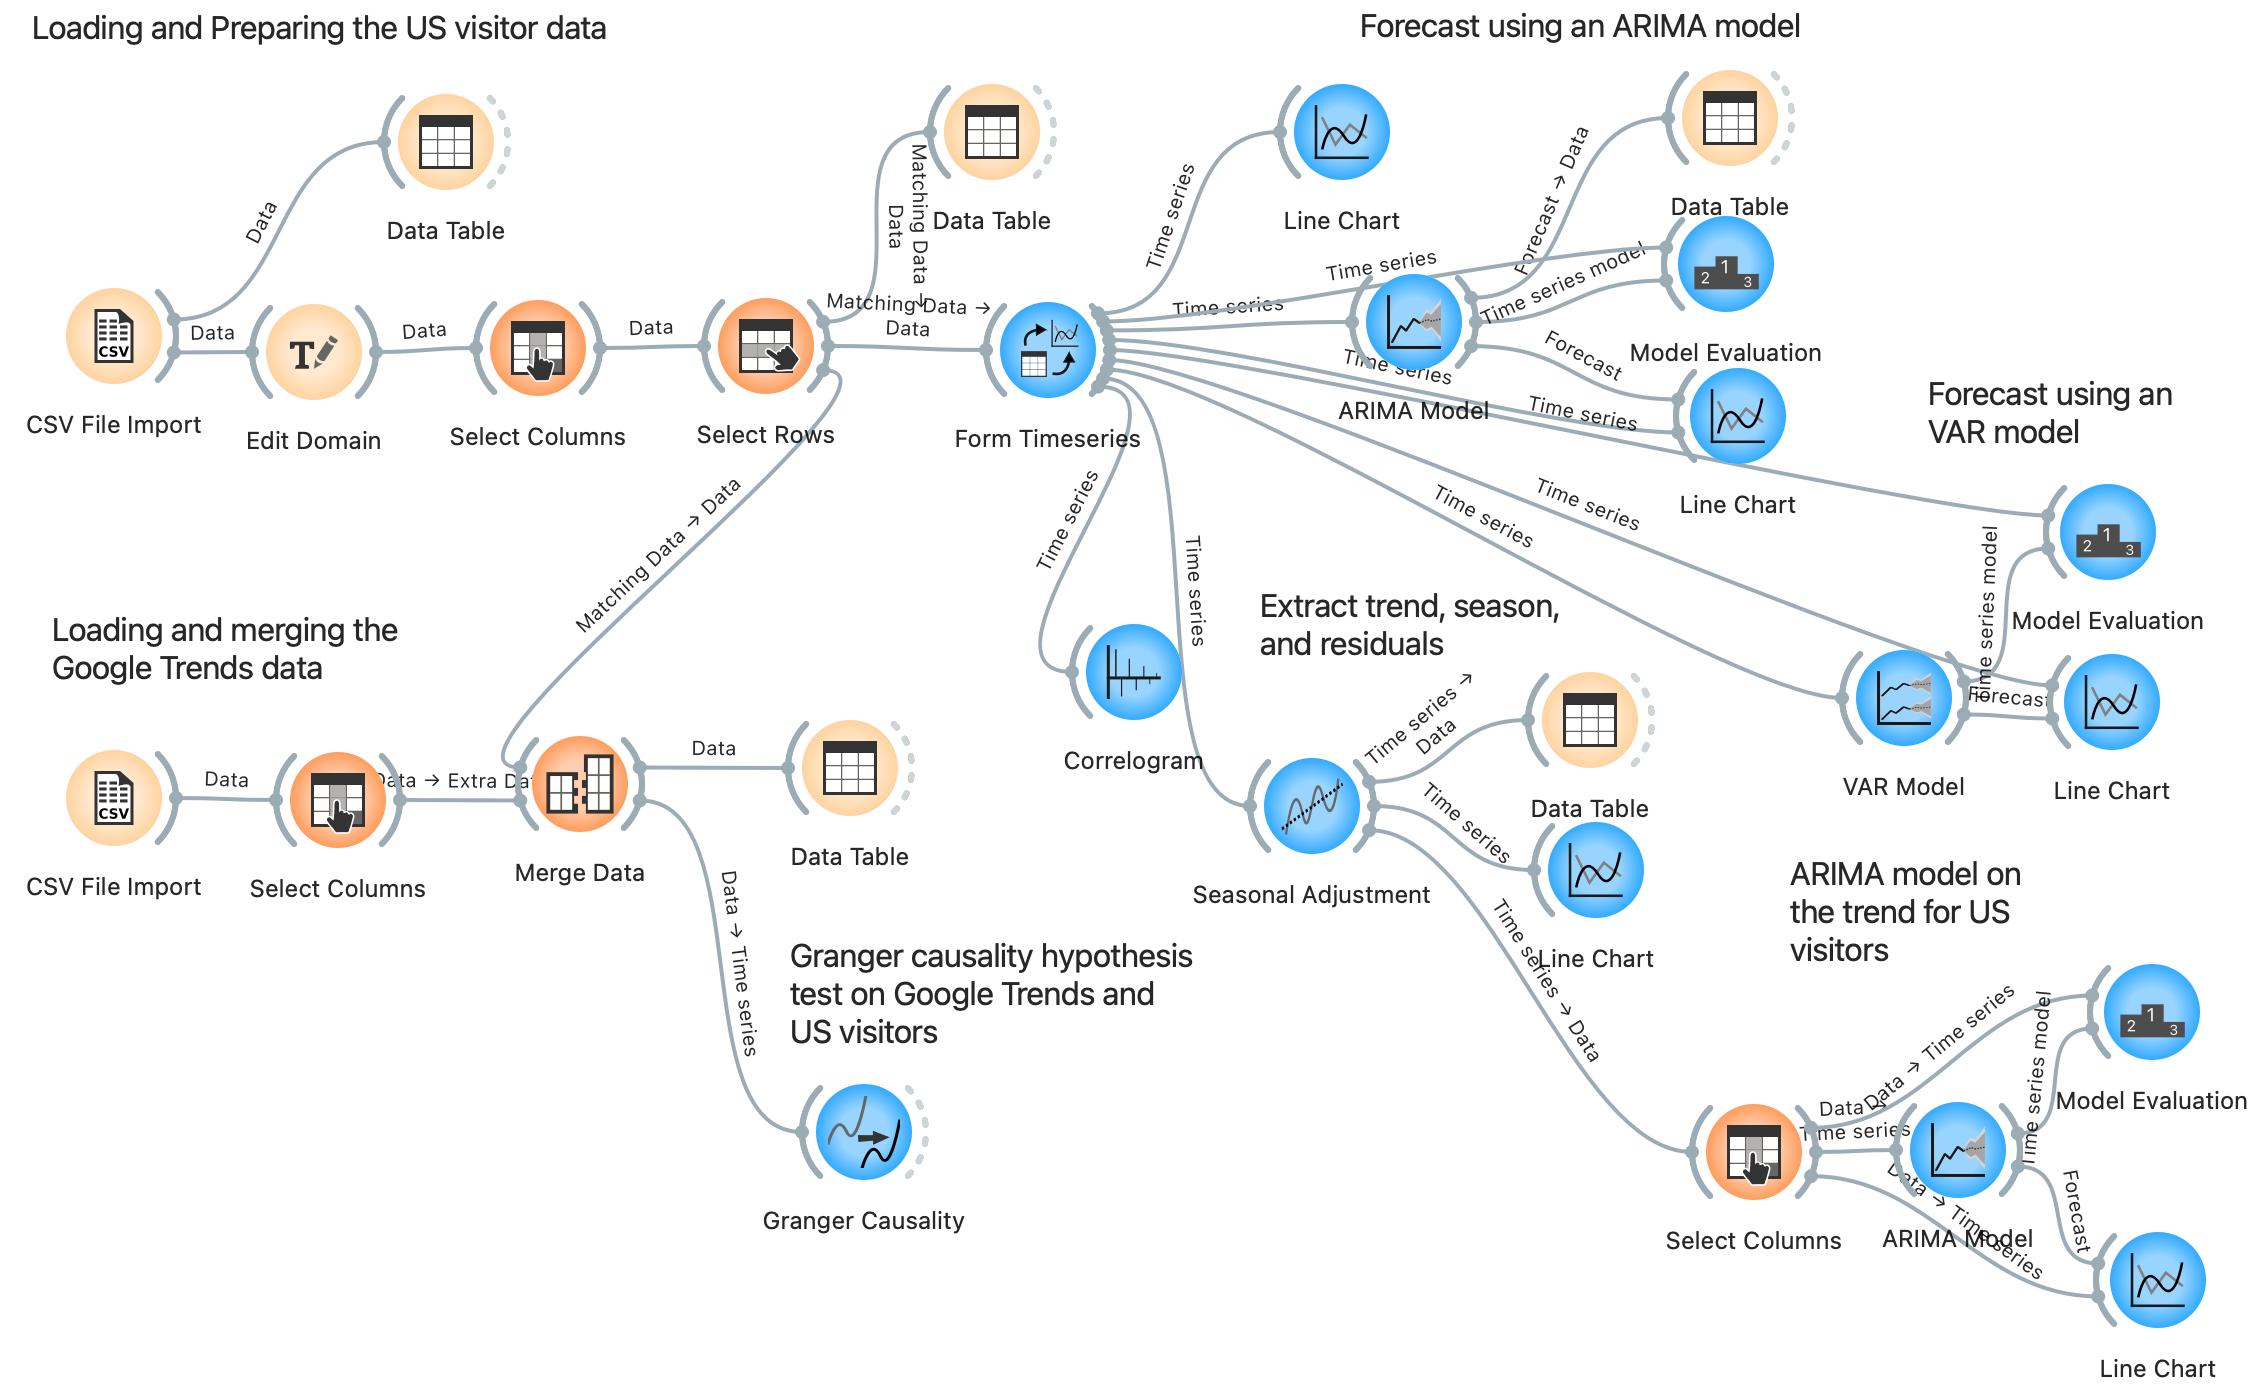
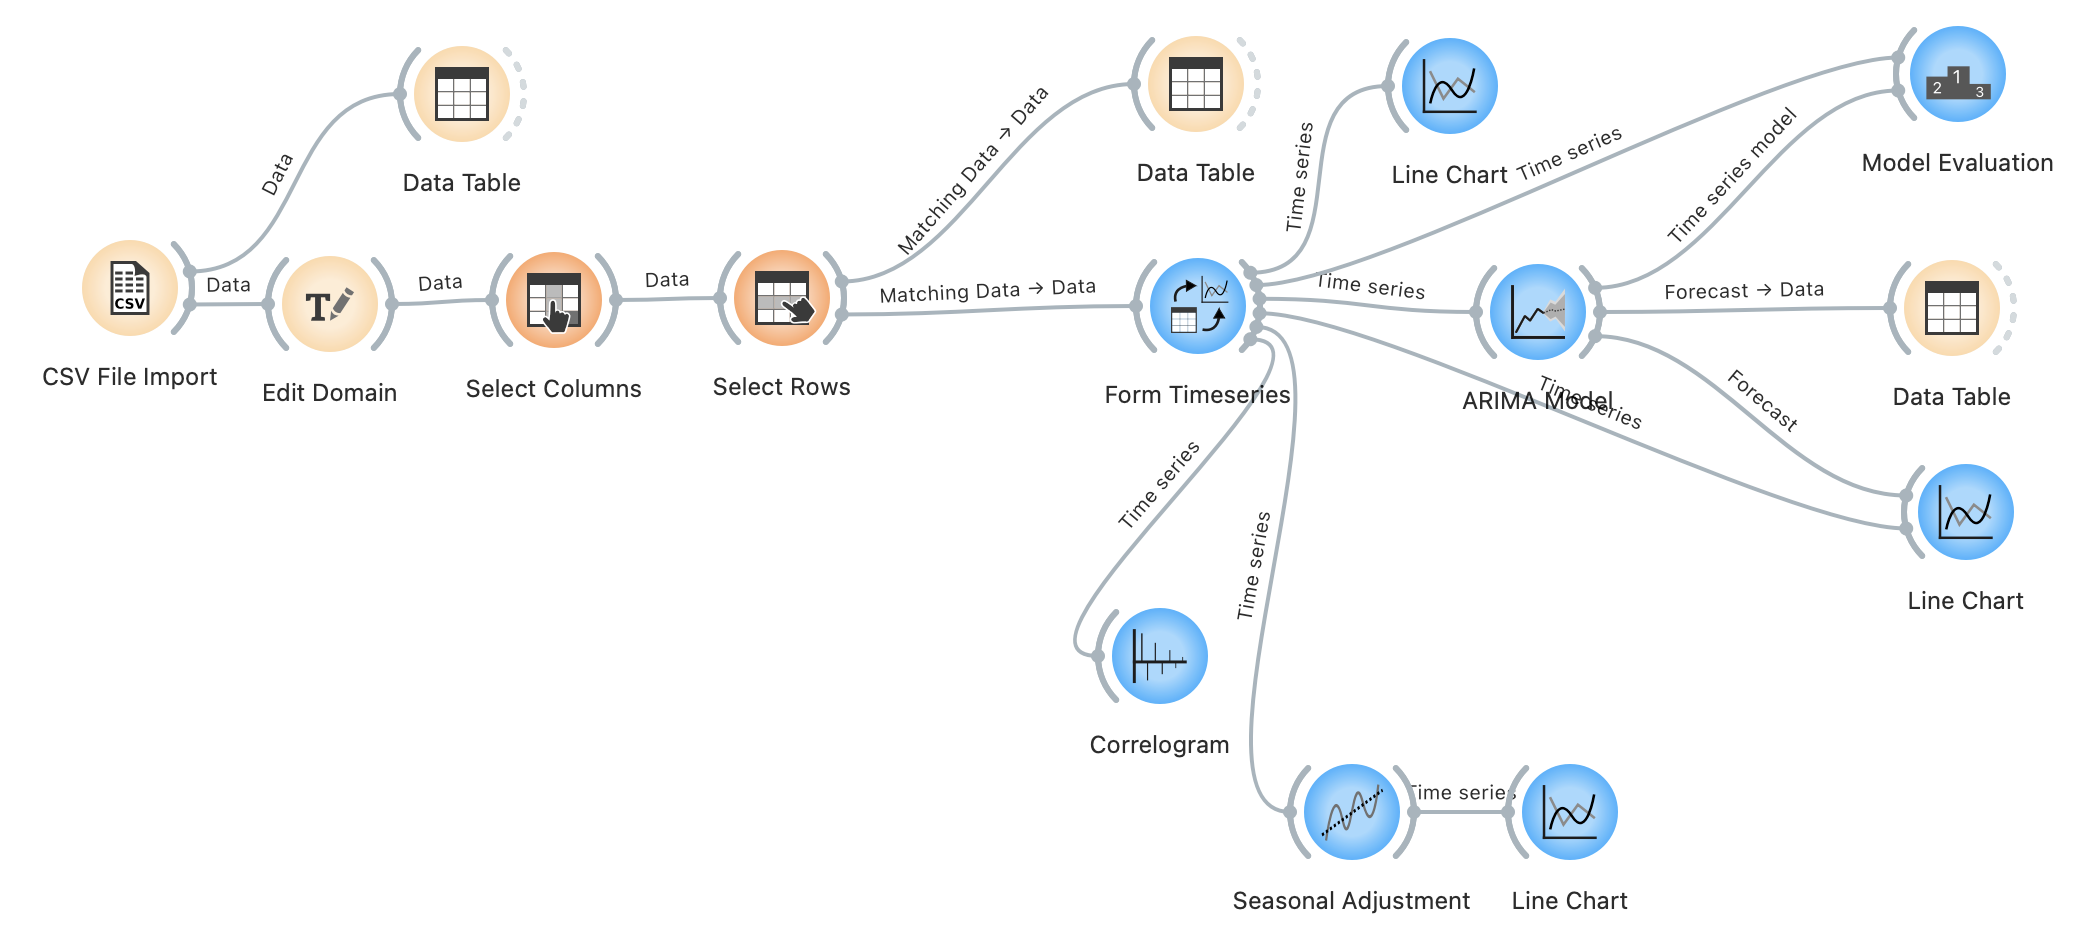
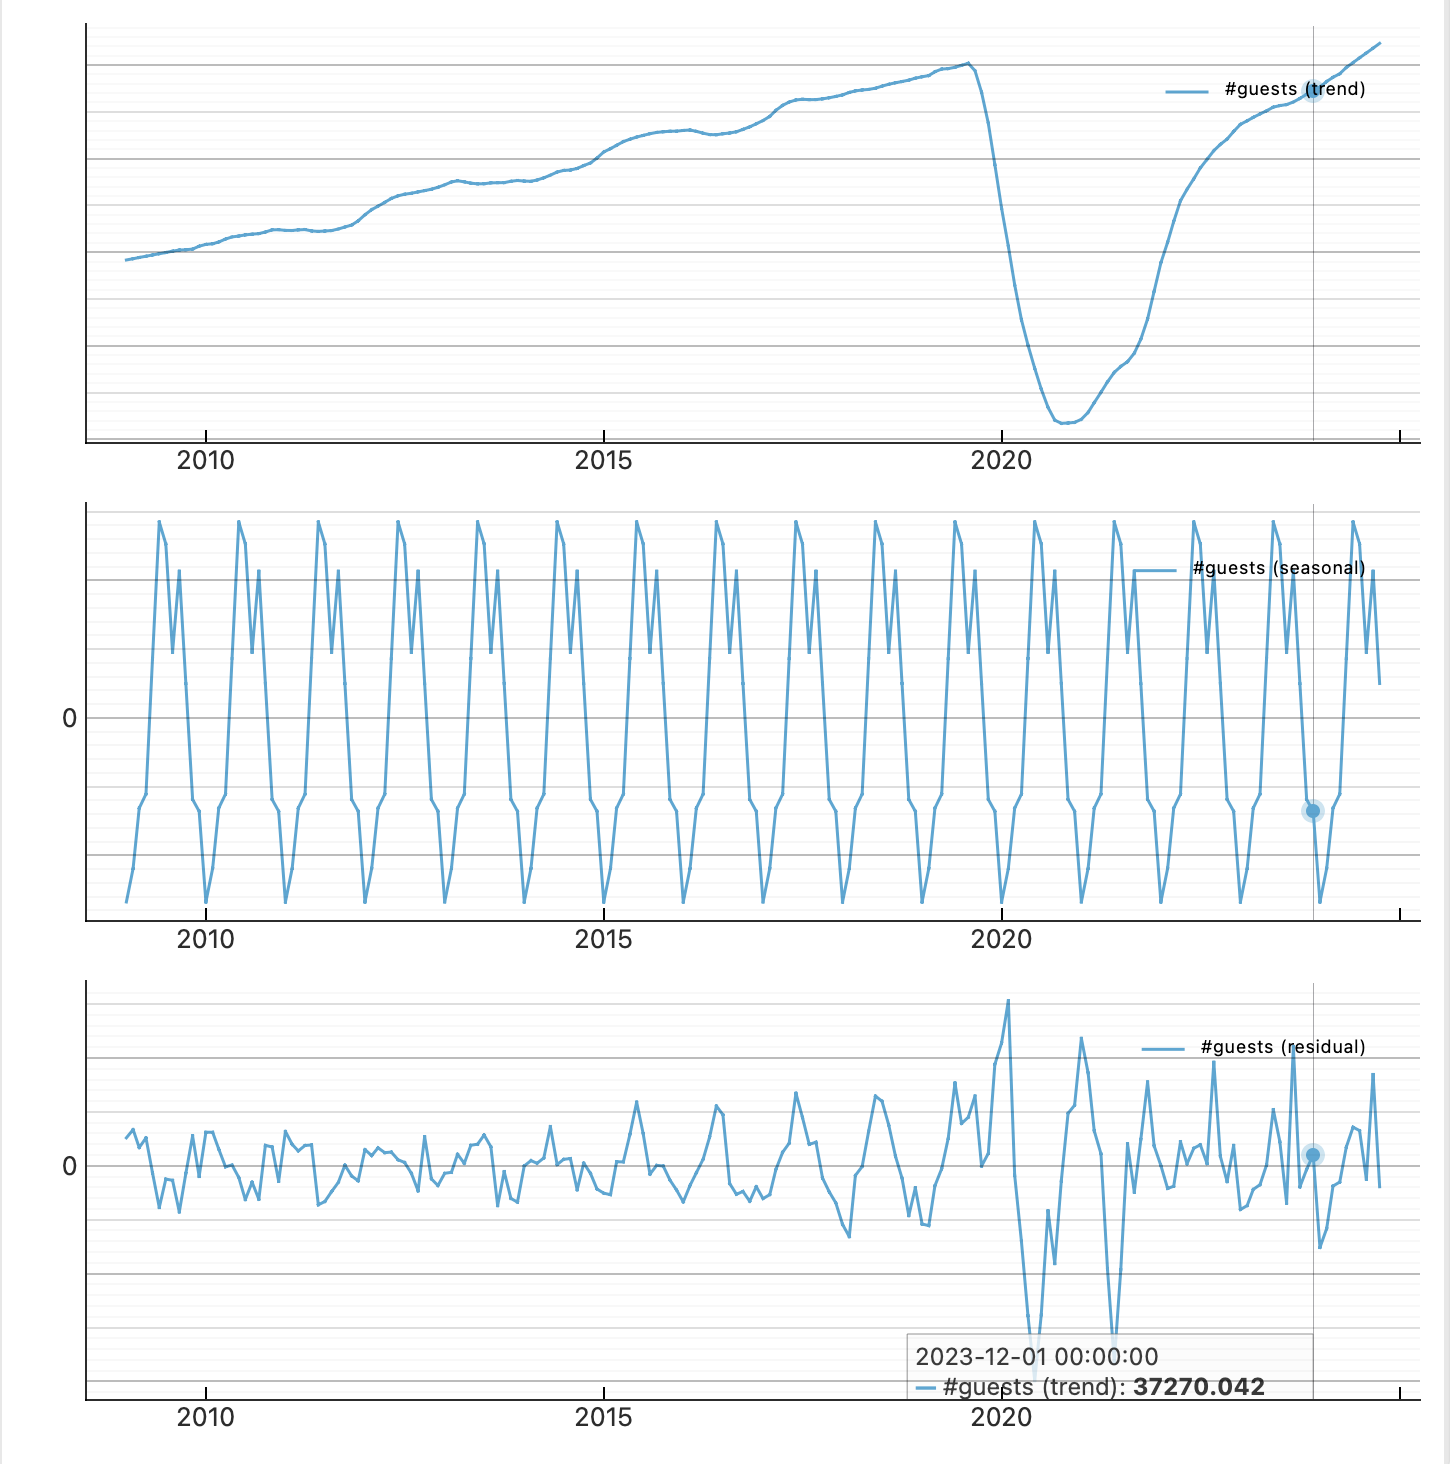
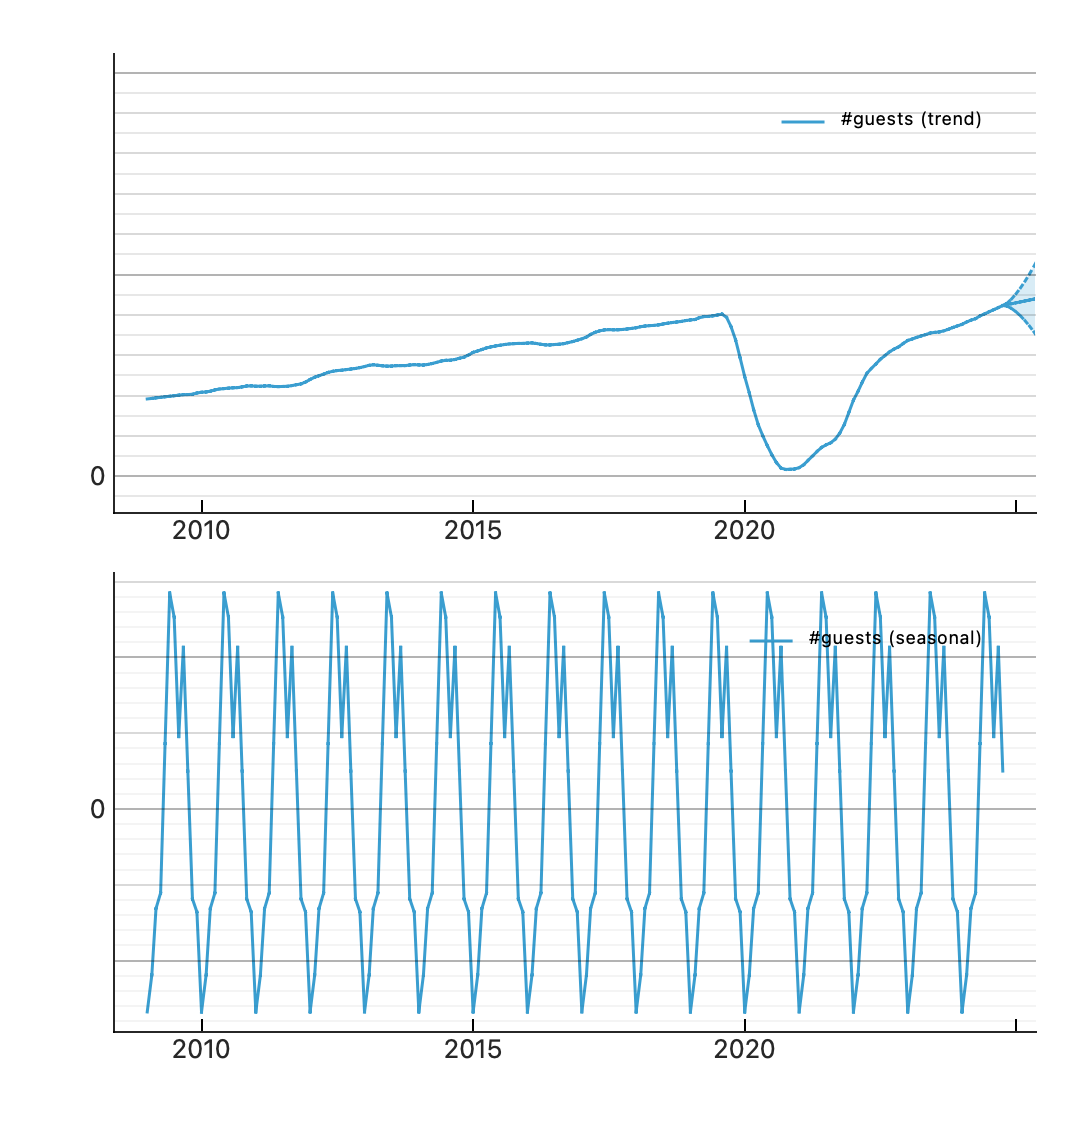
 Seasonal Adjustment node. How did you choose the seasonal period? Find a way to let Orange determine the seasonal period. This way the computer figures out a value itself instead of us trying manually. It also helps to review and critically question our guessed value.
      • Apply an ARIMA model to the trend of US visitors and create a line chart of the trend with forecasting and a line chart for the seasonal pattern.
        ARIMA trend forecast
    • Task
      • Orange does not provide an SARIMA (ARIMA model handling also seasonality patterns; see https://datascience.stackexchange.com/questions/120136/seasonal-arima). Check out other models and try to use these for forecasting US visitors and forecast 5 years ahead.
        Forecast

      • Perform a statistical hypothesis test in Orange to determine whether different time series from Google Trends predict the US visitors. What lag is reported for different search terms (see the google_trends.csv file below)? You can learn the very basics about a suitable hypothesis test at https://www.statology.org/granger-causality-test-in-r/. For this you have to merge the US visitor data with the Google Trends data similarly how you have done it in Metabase but now in Orange.
    • Orange Workflow for US visitor data